
MLE NPAP Latency Analysis Results
MLE analyzed processing latency using RTL simulation of two instances of MLE NPAP (using different clock speeds) connected via 10G LL MAC via XGMII (clocked at 156.25 MHz).
| TCP Payload Size [Byte] | Clock cycles | Latency [ns] at 175 MHz | Latency [ns] at 322 MHz | Latency [ns] at 550 MHz |
|---|---|---|---|---|
| 1 | 62 | 354.3 | 192.5 | 112.7 |
| 32 | 67 | 382.9 | 208.1 | 121.8 |
| 64 | 73 | 417.1 | 226.7 | 132.7 |
| 160 | 91 | 520.0 | 282.6 | 165.5 |
| 448 | 145 | 828.6 | 450.3 | 263.6 |
| 960 | 241 | 1,377.1 | 748.4 | 438.2 |
| 1216 | 289 | 1,651.4 | 897.5 | 525.5 |
| 1456 | 334 | 1,908.6 | 1,037.3 | 607.3 |
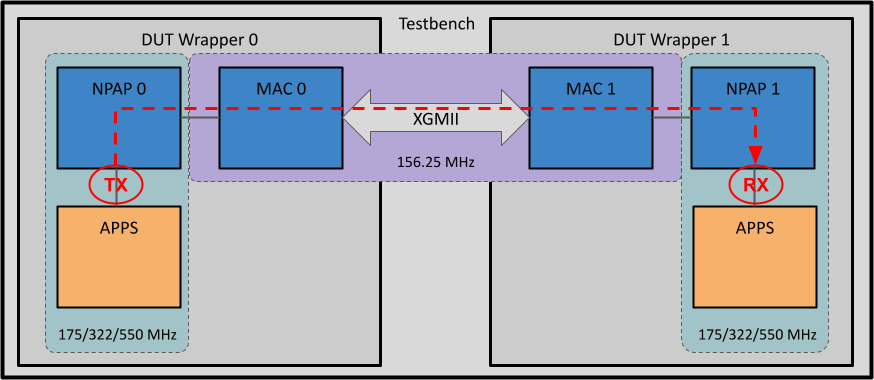
Latency was measured “one-way, door-to-door”: Using RTL simulation we count the number of clock cycles it takes from sending payload data from one MLE NPAP instance (TX) via the full MLE NPAP kernel until the other instance of MLE NPAP instance receives that payload data (RX). Here the system-level block diagram:
Obviously, increasing the NPAP clock frequency will reduce latency for asynchronous NPAP subsystems. More information on dependable latency numbers can be found in our Technical Brief “Myth-Busting Latency Numbers for TCP Offload Engines.”